Estimated reading time 5 minutes, 53 seconds.
Unprecedented gains in North American business aircraft flight activity over the past few years have largely eliminated the losses felt by the economic crisis during 2008 and 2009. This leads us to ask: Since this unprecedented growth, what are the factors influencing Canadian flight activity and what exactly is Canada’s stake in business aviation?

To answer these questions, we’ll dive into past flight activity and data recorded by ARGUS International, which has been analyzing business aviation flight activity with the use of its flight tracking software, TRAQPak, since 2007.
Today, TRAQPak data shows us that business aviation activity continues to remain strong through 2017 for all of North America. In fact, year-over-year gains were recorded every month this year, according to the ARGUS TRAQPak 2017 Midyear Business Aviation Review, a 13-page report detailing flight activity in North America during a six-month period.
Along with a rise in year-over-year gains, year-to-date flight activity saw a 3.9 per cent gain from 2016–with flight hours rising up to six per cent.
Canada, specifically, has experienced growth in the first half of the year, with an increase in flight activity of 4.7 per cent compared to the same period last year. For the last 12 months, operations in Canada have shown an increase of 2.6 per cent over the previous 12 months, with a total of 201,580 business aviation flights–giving Canada a 6.7 per cent stake in the total North American flight activity volume during the same period.
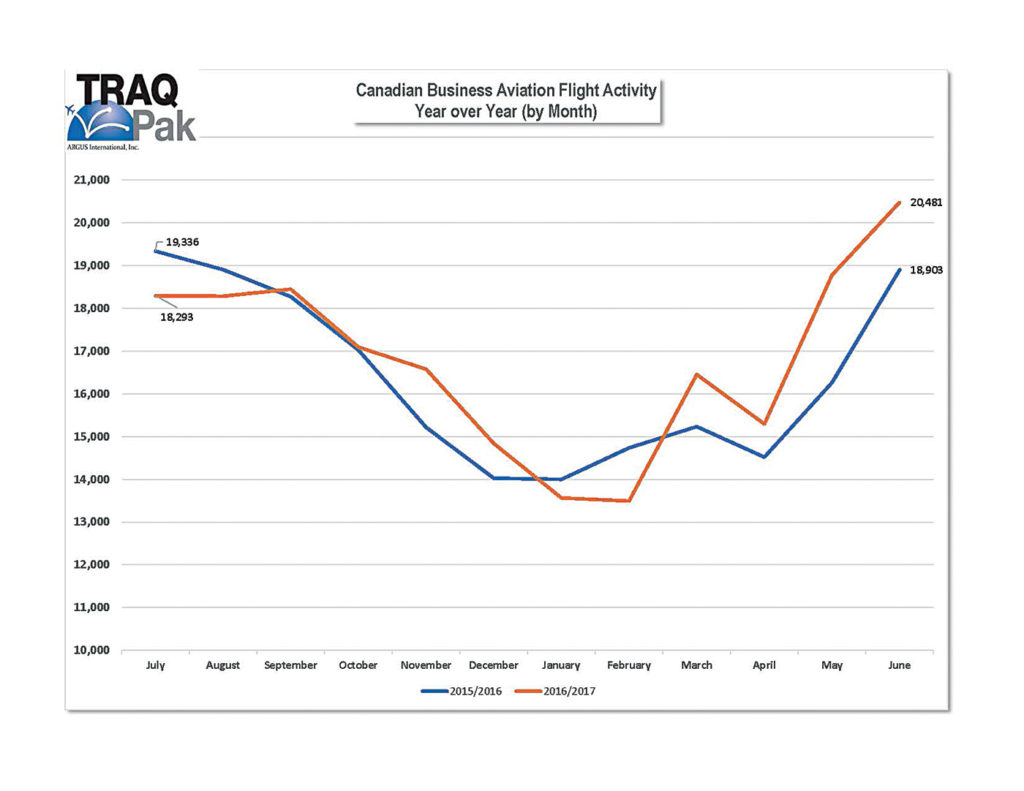
Flying patterns are different in Canada compared to the United States. Because of these differences, flight activity peaks in Canada in the summer months–June, July, August and September–while the U.S. has higher activity March through October. Notably, Canadian flight activity for June 2017 was up 8.3 per cent over June 2016, with 20,481 flights recorded.
This activity pattern isn’t surprising given the longer winter season Canada experiences. From October through April, Canada experiences a lull in flight activity due to strong winter conditions during these months. Comparatively, the United States usually sees a four-month lull in flight activity from November to February due to both weather and seasonal activities.
North American flight activity continues to be “very strong” in the Part 135 (on-demand charter) segment, rising 10.1 per cent during the first six months of 2017 compared with the same period a year ago.
Additionally, the Part 91K (fractional) segment was up 5.7 per cent, indicating that in the first half of the year the industry “has finally managed to put the consolidation behind it.”
Meanwhile, Part 91 (general aviation) has been flat this year, declining slightly by 0.5 per cent year-over-year in the first six months.
The charter industry is also the standout for Canadian operations, increasing 11.9 per cent year-over-year. The fractional sector in Canada also showed impressive gains, up 8.3 per cent for the period. The only sector to see a decline was general aviation, which saw a decline for the first half of 2017–down four per cent year-over-year.
Looking at activity by day of the week, it is not surprising that business days see the most recorded flight activity for business aviation. Flight volumes ramp up slowly throughout the week until Thursday, which sees the most business aviation departures. This is true for both the U.S. and Canada.
Reviewing activity by province, Canada’s more populous regions saw the highest flight activity.
Quebec had the most departures for the period at 47,359, with Ontario coming in a close second at 46,830 flights (up 13.2 per cent over the previous year).
Of the top four provinces, Alberta was the only one to record a year-over-year decline in activity. The decrease in Alberta follows a similar pattern in U.S. oil-producing states. North Dakota, Alaska and Oklahoma have all seen a decrease in flight activity over the last 18 months as oil prices have dropped.
At the time of writing in mid-August 2017, TRAQPak analysts estimated that North American flight activity in August, September and October 2017 would rise 2.9 per cent when compared to the same period in 2016, keeping the business aviation growth trend alive.
Shirley Mason is executive vice-president of ARGUS International, Inc., a specialized aviation services provider.
Notes
- TRAQPak data is aircraft flight number specific arrival and departure information on all IFR flights in the U.S. (including Alaska and Hawaii), the Caribbean and Canada;
- For the purposes of this report, FAR Part 135/on-demand charter flight data represents all flight activity on a Part 135 charter certificate, regardless of individual flight mission (excluding cargo, scheduled Part 135, and fractional operators).